
Trigger Points: Mapping the Fastest Paths to Climate Repair
October 8
By Ali Bin Shahid
Member of the EcoRestoration Alliance
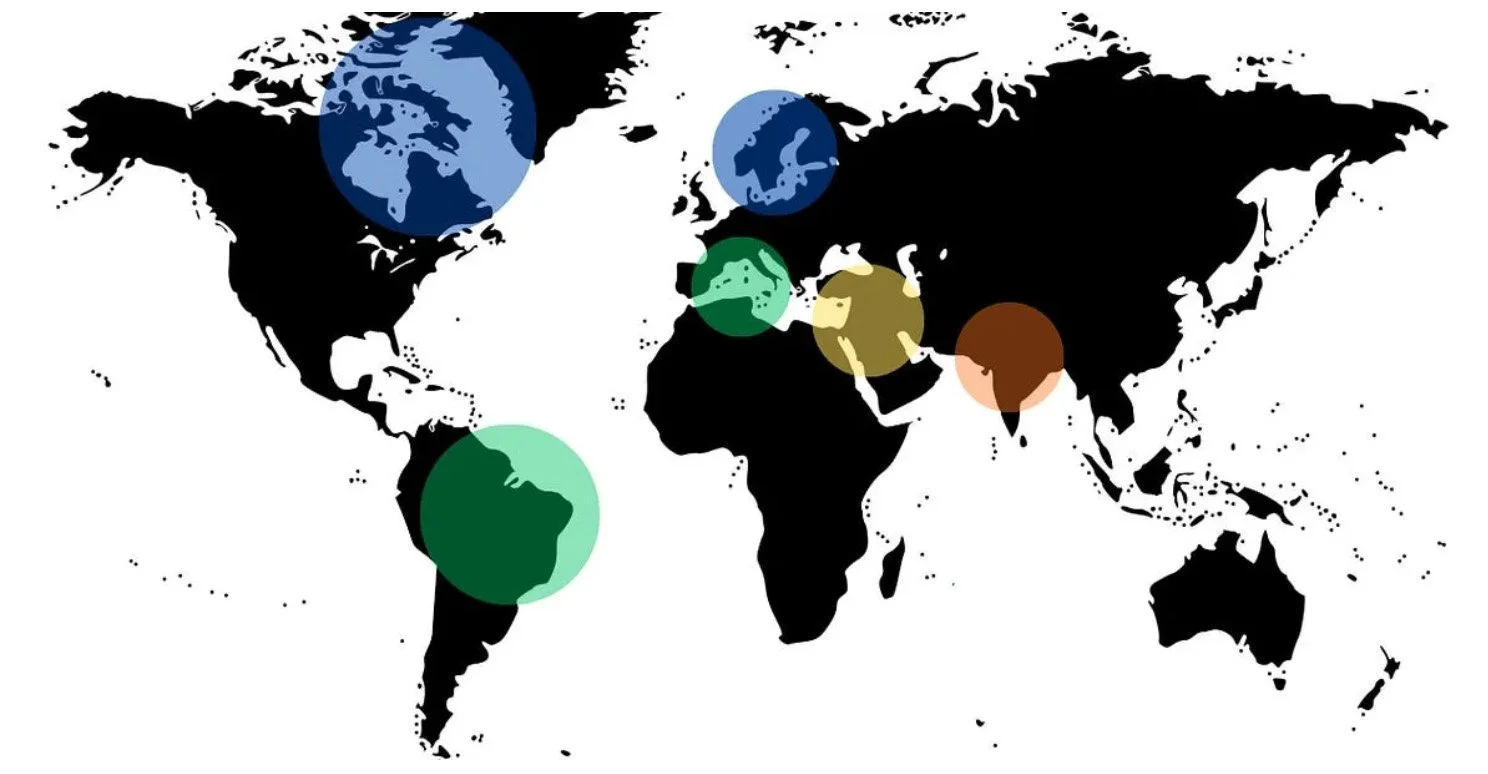
I often notice confusion when I bring this topic up. Some think I’m referring to the recent IIASA map of “climate danger zones”, where Kornhuber et al. (2024) charted regions heating faster than global models predict; northwestern Europe, central China, and the Arabian Peninsula among them. Others imagine a map of the global water cycle. And Still other’s who imagine Rockstrom’s planetary boundaries.
But what I mean by trigger points is something altogether different. These are not generalized “vulnerable zones” but precise levers: locations or processes where a small, correctly timed action can reset a much larger system. If one imagines the structure of change as a vector (like the eight-dimensional geometry of E₈) then by tracing that vector backward, we can approach the equilibrium that existed before deviation. I have extensively talked about this here or if you want a quick overview you may read this post.
The reason this differs from the carbon narrative is structural. The carbon framework averages out the world; spatially, temporally, chemically. It erases nuance. Rapid events disappear into annual means; biospheric feedbacks dissolve into uniform grids. But water, and the life it carries, do not average. They hinge on phase changes, boundaries, and thresholds.
It’s also different because this is repair work, not predictive work. Repair requires precision; interventions tied to ground, to measurement, to cause and effect at human scale. It demands a much higher resolution than any global abstraction can offer.
Let’s walk through a few landscapes that make this clear.
Another Time Lapse from NASA earth explorer - On a side note, here is what the site say, "Due to the lapse in federal government funding, NASA is not updating this website. We sincerely regret this inconvenience."
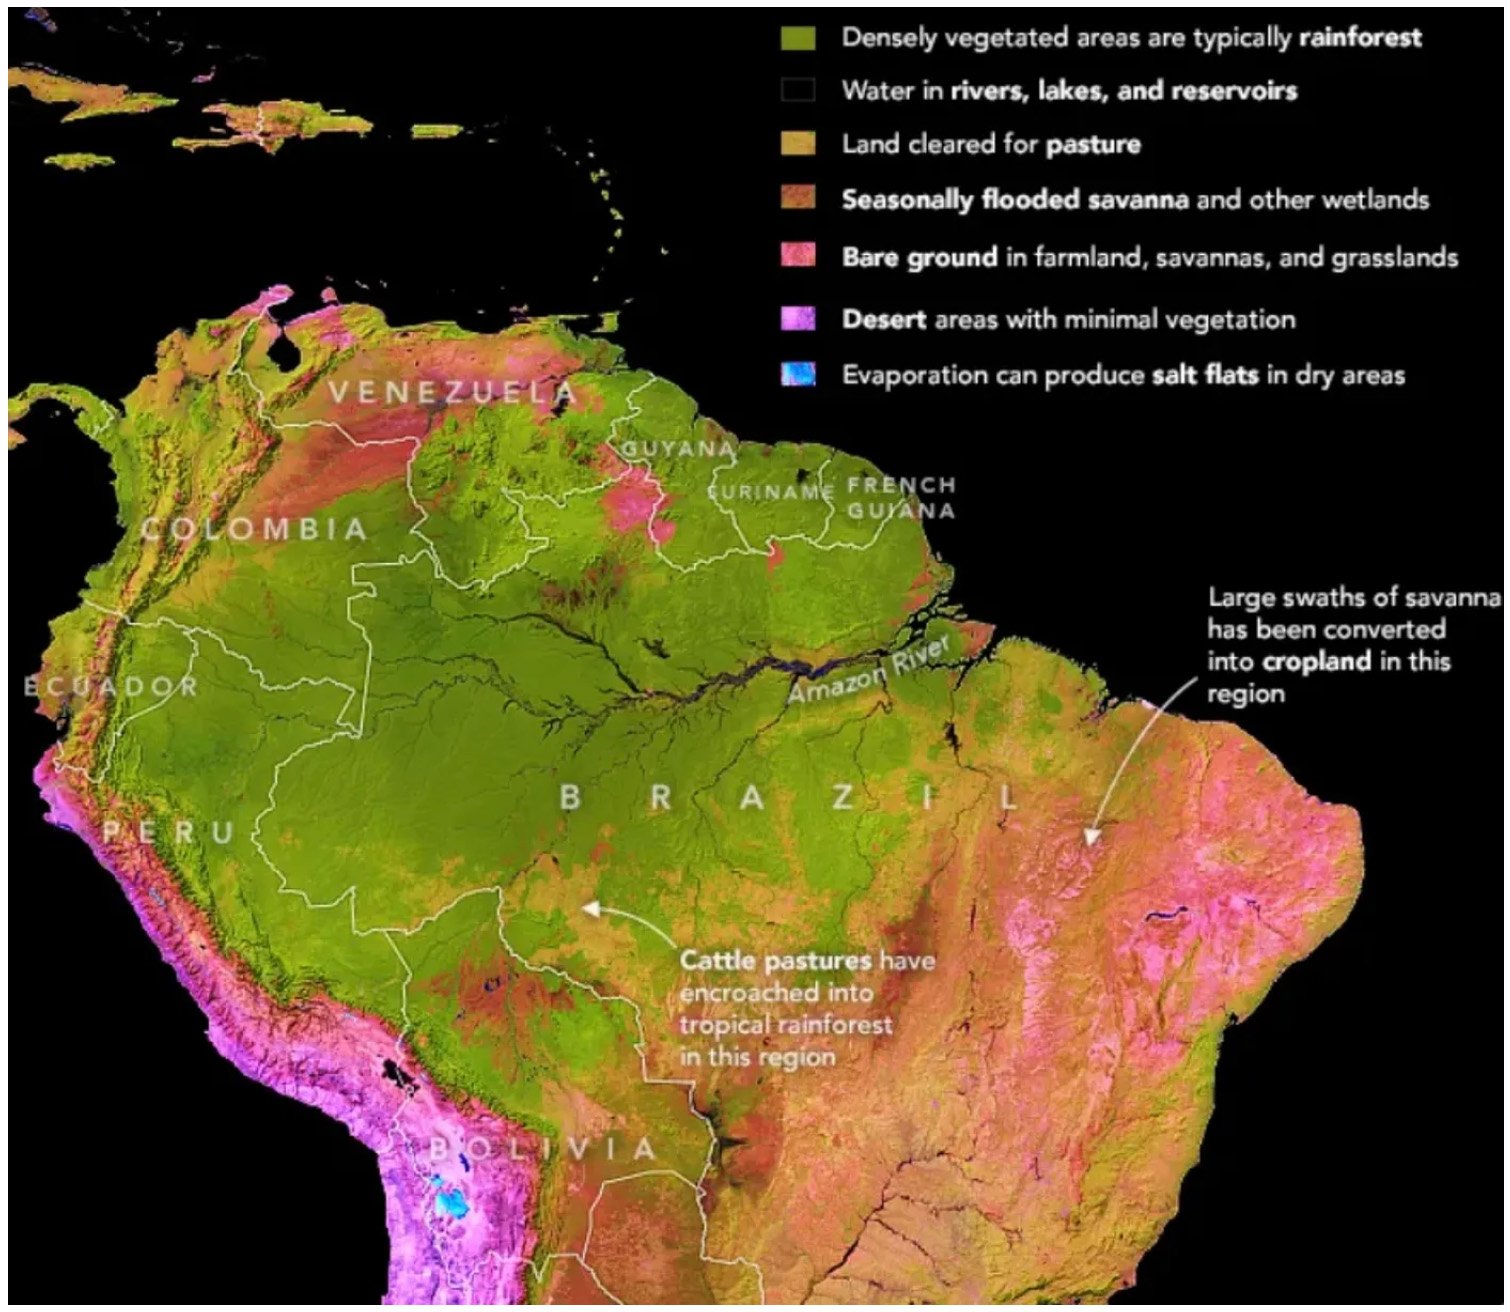
Over the past century, the Amazon’s rainfall has trended downward wherever forest cover has declined. Deforestation now touches about 25% of the basin, and coupled oceanic stresses from ENSO and the Pacific Decadal Oscillation add an effective pressure of roughly 8%, taking the net hydrological impact to one-third of the system (Leite-Filho et al., 2021).
Our Rainfall analysis reveals that the biotic pump corridor (stretching inland from Coastal Belem to Maranhão and Pará into Amazonas) has weakened to about 70% of its historic vigor. Coastal rainfall still averages nearly 2,900 mm per year, but within a few hundred kilometers inland at the Maranhão-Pará boundary, it falls to 1,840 mm (Flores et al., 2024). The winds expend their load at the shore, and the deforested fore-belt lacks the evapotranspiration to recharge them.
By the time the same air reaches Manaus, rain recovers modestly to 2,100 mm but, the deficit is already set. Malhi et al. (2009) identified a savannization threshold near 1,800 mm per year; once regional rainfall dips below that, the forest struggles to regenerate.
The implication is profound. Restoring the Para-Maranhão corridor, which covers only a fraction of Amazonia and is now merely 25% forested, could reamplify the inland moisture pump and stabilize the basin. Instead of treating the Amazon as one undifferentiated mass, this approach identifies a narrow trigger point: a region small enough to heal, but powerful enough to cool the continent.
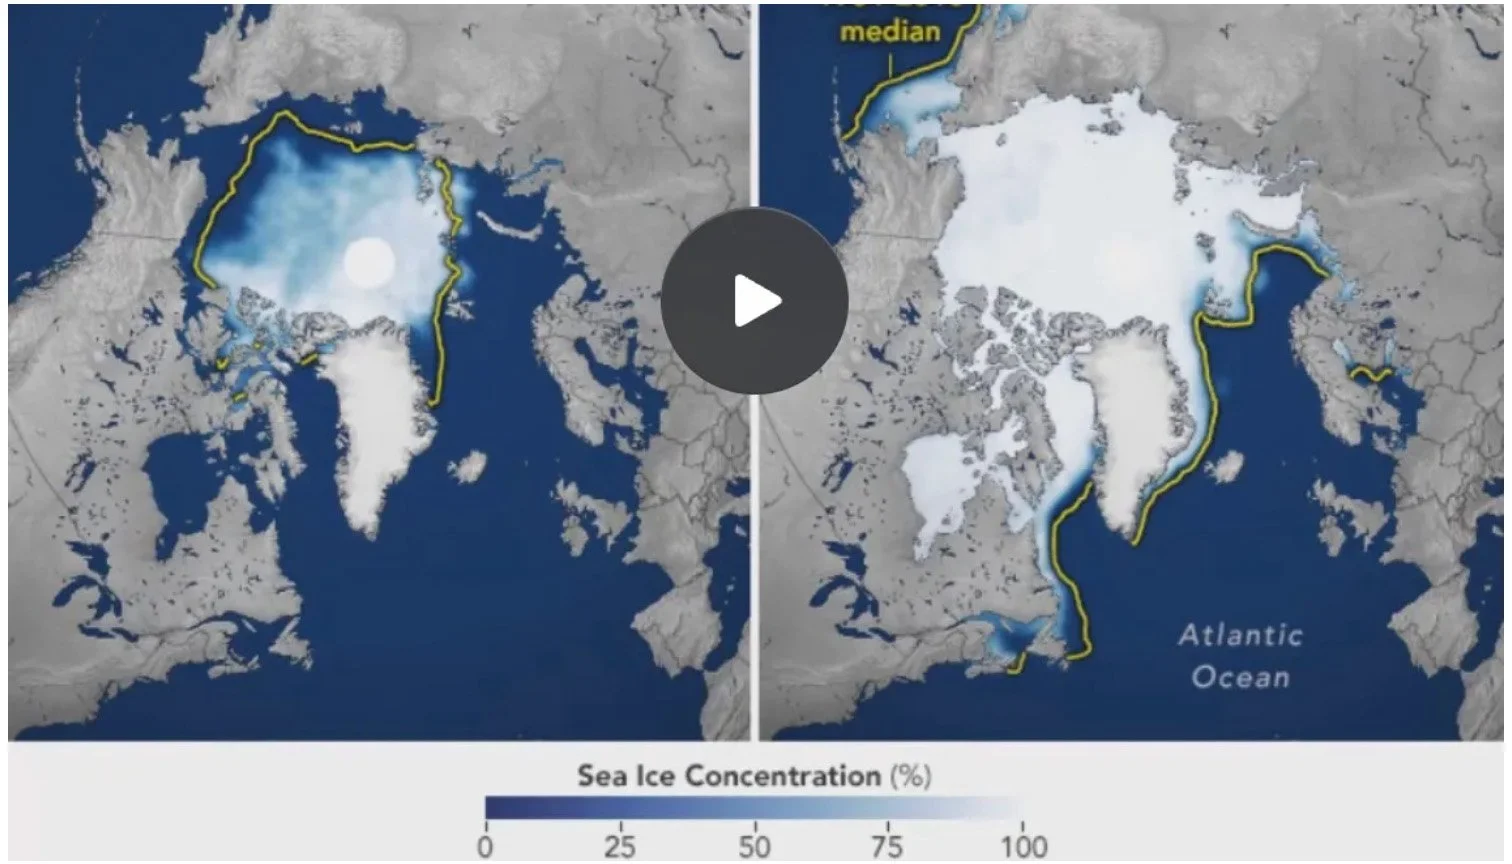
These image pairs show the average concentration of Arctic sea ice for the month of September (left) and the following March (right) from September 1990 to March 2025. The yellow outline on each image shows the median sea ice extent for September and March as observed by satellites from 1981 to 2010. The median is the middle value; that is, half of the xtents were larger than the line, and half were smaller. Source: https://earthobservatory.nasa.gov/world-of-change/sea-ice-arctic
In the Arctic, the hinge is not trees but timing. Hydroelectric dams release stored water during the depths of winter. The discharge emerges near 4 °C into air colder than −40 °C, generating vapor plumes that act as localized heat engines. You may head out to the blindspots section, where I have extensively talked about them.
My own analyses in posts #190 and #191 extend that logic: artificial vapor releases from dams function like repeated intrusions, adding 70–80 W m⁻² of localized radiative forcing across footprints of 200–300 km.
Such events are too brief and spatially confined to register in coarse-grid models, yet their cumulative effect aligns with observed winter ice melt anomalies near dammed basins. The sequence unfolds as follows:
moisture injection → cloud nucleation → longwave trapping → surface warming → freshwater stratification → reduced salinity → weaker Atlantic overturning (AMOC)
(Sokolowsky, G.A. et al., 2020, Journal of Climate; see aso NOAA Repository Report 63641)
That is the logic behind the work we are doing as , placing regenerative festivals on these ridges. Participants build bunds, plant, mulch, and weave fog-capturing mesh, creating both ecological function and cultural memory. Each site becomes a trigger point, an anchor for a returning cycle.The image on the right shows flooding along major rivers in the region on September 9, 2025. For comparison, the left image shows the area on the same day in 2023, when monsoon rainfall amounts were close to normal. The images were acquired with the VIIRS (Visible Infrared Imaging Radiometer Suite) on the NOAA-20 satellite and are false-color to emphasize the presence of water.
Pakistan contains the full vertical spectrum, from foothills to Concordia’s 8,000 m peaks. If the lower bands stay overheated, clouds bypass them, releasing moisture only on high rock. By cooling and moistening foothills, we shift the release downward, catching rain where ecosystems live, not where ice dies.
The maps are based on data from the Moderate Resolution Imaging Spectroradiometer (MODIS) on NASA's Terra satellite. Green areas show aerosol plumes dominated by larger particles. Red areas show aerosol plumes dominated by small particles. Yellow areas show plumes in which large and small aerosol particles are intermingling. Gray shows where the sensor did not collect data.
Not all trigger points lie on land. Some are written in the air itself.
A small change in aerosol load can delay rainfall by kilometers of altitude. When droplet effective radius falls below about 14–15 µm, coalescence stalls and warm-rain production ceases (Rosenfeld, 2000; Fan et al., 2020). Even an aerosol optical depth increase of 0.01 can move the condensation level by several hundred meters (Barthlott et al., 2021).
Inversion-dominated basins behave similarly: when the lapse rate tightens below ~2 K km⁻¹, convection locks. Trapped moisture and pollution accumulate until surface roughness or vegetation evapotranspiration punctures the lid.
In pine monocultures, when canopy closure exceeds ~80 % and fine-fuel moisture drops below ~10 %, the forest’s feedbacks flip toward ignition volatile oils and low humidity forming self-sustaining fire regimes (Agee et al., 2020).
Each of these is a numerical hinge. A measurable point where a small Δinput produces a large Δoutcome, from droplet radii to canopy fractions to albedo. The physics remains constant: fine thresholds, outsized feedbacks.
In a coming episode, I will go deeper into the physics of aerosols and how they can be used to evade storms, postpone rainfall, and much more...
So if I were to define it precisely:
A trigger point is the smallest spatial or temporal locus within a coupled Earth system where an incremental intervention crosses a known or emergent threshold, restoring feedbacks toward equilibrium rather than away from it.
In the Amazon, it is the rainfall drop within the biotic pump’s pathway.
In the Arctic, it is the timing of winter releases that drive vapor forcing.
In Iberia, it is the altitude where interception first becomes effective.
In Pakistan, it is the elevation band where infiltration lowers cloud release.
In the atmosphere, it may be a droplet radius, a lapse rate, or a canopy density.
Every region hides such hinges, points where action is most leveraged, where physics and biology rejoin. Identifying them is the fastest route to cooling the climate because they collapse scale: small effort, systemic return.
Originally published at https://r3genesis.substack.com.
+
Read more of our blog posts on Medium